Through platforms like Google Ads and Microsoft Advertising, businesses can get in front of people searching for the products or services that they offer. While it’s relatively easy to get these ads up and running, making sense of the data in your account can be difficult.
By paying attention to the following PPC stats, you will be able to better determine how your digital marketing strategy is performing. And with your newfound knowledge, you can make strategic adjustments based on data.
1. ROI/ROAS
Depending on your business’ goals and specific industry, you will want to look at either your return on investment (ROI) or return on ad spend (ROAS) to get a feel of how your ads are doing.

For e-commerce businesses that draw connections between ad clicks and products sales through conversion tracking, you should be monitoring ROI. This key performance indicator (KPI) can be calculated by subtracting the cost of goods sold from revenue all divided by said costs.
If you are a lead gen company focused on increasing online form submissions or the amount of phone calls you receive, you should monitor your ROAS. These businesses can set up phone call tracking through the services of companies like CallRail to measure the effectiveness of their ad strategies.
Calculating ROAS is quick and easy, all you have to do is divide revenue by your total ad costs. If you have a ROAS of 5, for example, that means your business is earning $5 from every $1 you spend in PPC advertising.
2. Cost Per Lead/Acquisition
All marketers and business owners should know whether or not their PPC efforts are turning a profit. Profitability is more than simply determining if your ads are bringing in customers. Based on your business type, you will need to look at cost per lead (CPL) and/or cost per acquisition (CPA) to accurately conclude if your strategy is effective.

For both KPIs, you’re going to need to consider your margins for each sale or lead and weigh them against your CPL and/or CPA. Let’s say you’re an e-commerce business that sells a single product and with every sale you make $45 in profit. If you discover your CPA is $50, that means your business is losing $5 for every sale you make through your PPC ads!
Even with a low CPL/CPA you could be making money in the long run, through customer lifetime value. Checking on these PPC stats regularly will let you know which ads could drive profitability with improved strategies.
3. Location Data
Your Google Ads and Microsoft Advertising accounts are full of user information you can use to design a better PPC approach. Take a deep dive into the location data in your accounts to find out where your clicks are coming from, where people are buying your products, and where people who are filling out forms on your site are located.

Use the insight you find to build out highly targeted ad serving strategies based on factual data. For example, if your PPC stats indicate certain cities or states are buying more than others, you might want to consider bidding more aggressively in those areas.
Furthermore, if you’re looking to expand your brand into a new area and worry that you don’t have the budget to get the results you want, consider temporarily lowering bids in underperforming locations. With that ad spend freed up, you can raise keyword bids in cities, states, or even zip codes your business wants to focus on.
4. Device Data
In line with how you’d look through your location data to find trends in your PPC stats, you can do the same with device data. By exploring the “Devices” tab of an individual campaign, you can tell in an instant what devices your ad clicks are happening on.

Let’s say you discover a majority of ad clicks for a certain keyword are happening on mobile but they are converting to sales better on desktop. You could increase bids on mobile to secure a larger share of the market where users are first being introduced to your brand.
Knowing where your ads are being clicked and at what stage in the buying process these users are on each device will help you strategize more effectively. B2B companies tend to find more success on desktop while B2C brands see better results on mobile. How your business’ ads perform online might be different though, so it’s important to study up on cross-device attribution reporting to get the full picture.
5. Ad Position Data
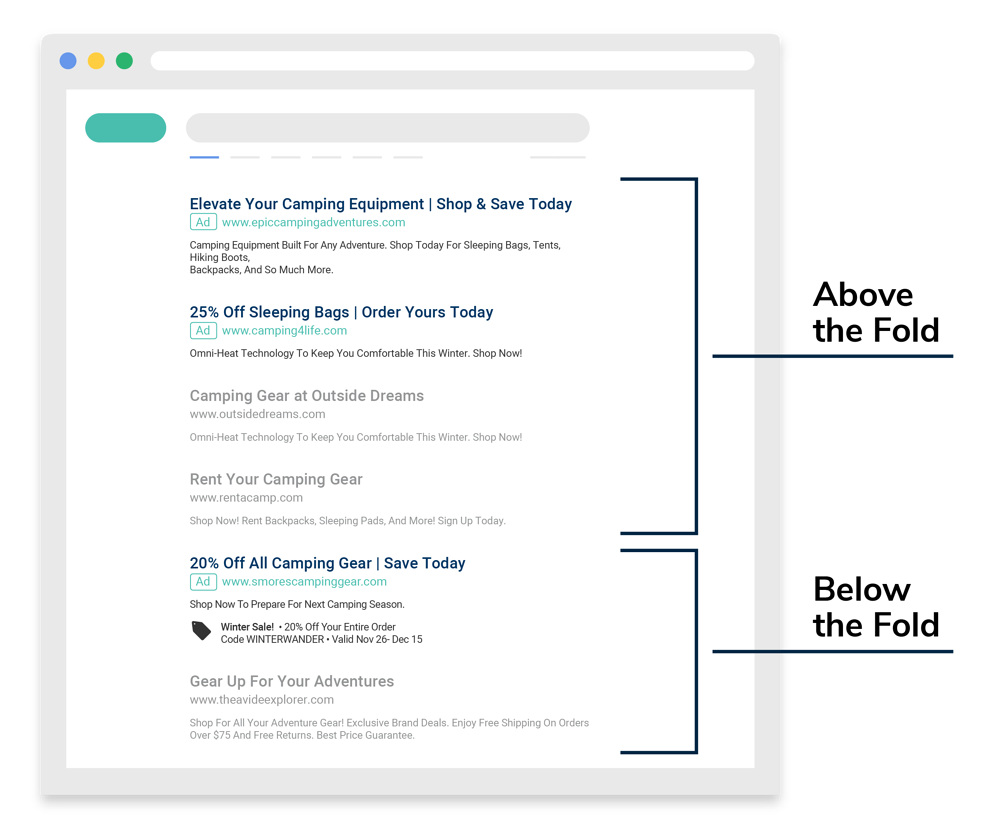
Where your ads appear on the search engine results page (SERP) can have a big effect on how they will perform. Generally speaking, ads that appear “above the fold” (aka the top few positions that users see on a SERP before scrolling down) get more attention and therefore have much higher click-through rates.

It won’t always make sense to shoot for the number one ad position with every keyword because it can get expensive, depending on what the first position bid estimate is. Take into account your margins and ideal ROI before asking yourself if it’s worthwhile to pay higher bids to achieve the top position.
In Google Ads, you can examine top and absolute top performance data to get an idea of where your ads are showing on the SERP. These PPC stats will show you which keywords are already appearing high on results pages and which need a boost. Besides raising bids to achieve higher ad positions, you can do work to optimize quality scores (QS) through revised ad copy and landing pages to improve those metrics.
Bettering your strategy, one step at a time.
Keeping better track of these PPC stats is an important step to take when assessing account performance. The changes you make can take time to show results, but you should see improvement over time. Interested in a professional evaluation of these, and other, PPC stats? Schedule a free digital marketing consultation with Logical Position today.
If you’d like more information on all the good stuff you just read about, check out our YouTube video!

Logical Position, an Inc. 500 digital agency supporting 5,000+ clients across North America. LP is the proud recipient of Google’s Lead Generation Premier Partner of the Year and Microsoft's Global Channel Partner of the Year 2024! The award-winning agency offers full-service PPC management, SEO, Paid Social, Amazon and Creative Services for businesses large and small. As a Google Premier Partner, Microsoft Elite Partner & Meta Business Partner, LP is in the top 1% of ad spend managed across platforms.


